摘要:
目的:利用光学相干断层扫描血管成像技术(OCTA)观察视网膜静脉阻塞患者黄斑区浅层和深层视网膜毛细血管丛血流密度、中心凹无血管区(FAZ)面积、黄斑中心凹厚度(CMT)等的变化,并分析其与视功能的相关性。方法:本组54例(眼)视网膜静脉阻塞(RVO)患者,其中34例(眼)视网膜分支静脉阻塞,20例(眼)视网膜中央静脉阻塞;健康对照组19例(眼),通过OCTA在以视网膜黄斑中心凹为中心的3 mm × 3 mm区域进行扫描,比较分析患眼、对侧眼及健康对照眼在FAZ面积、黄斑区血流密度、CMT的变化,分析其与最佳矫正视力(BCVA)的相关性。结果:患眼的FAZ面积均大于对侧眼和对照眼(P < 0.01, P < 0.05),且FAZ面积与logMAR BCVA呈正相关;患眼黄斑区浅层和深层的血流密度明显低于对侧眼和对照眼(P < 0.001, P < 0.001),且浅层及深层的血流密度均与logMAR BCVA呈负相关;患眼的CMT均较对侧眼及正常眼增厚(P < 0.001, P < 0.001)。结论:OCTA对于检测RVO黄斑区浅层和深层视网膜血流密度、FAZ面积等相关指标具有无创、便捷、准确的优点。RVO患者患眼较对侧眼及正常对照眼在浅层及深层视网膜血流密度和浅层FAZ面积均有改变,且FAZ面积和血流密度与RVO眼的最佳矫正视力相关。
Abstract:
Purpose: Optical coherence tomography angiography (OCTA) was used to observe the changes in the superficial and deep retinal capillary plexus blood flow density, foveal avascular zone (FAZ) area, and central macular thickness (CMT) in patients with retinal vein occlusion, and an-alyze its correlation with visual function. Method: We collected 54 (eyes) patients with retinal vein occlusion (RVO), of which 34 (eyes) had branch retinal vein occlusion and 20 (eyes) had central retinal vein occlusion; 19 (eyes) in the healthy control group, OCTA was used to scan the 3 mm × 3 mm area with the foveal fovea as the center, and the changes of FAZ area, macular blood flow density, and CMT in affected eyes, contralateral eyes, and healthy control eyes were compared and analyzed correlation of the best corrected visual acuity (BCVA). Result: The FAZ area of the affected eye was larger than that of the contralateral and control eyes (P < 0.01, P < 0.05), and the FAZ area was positively correlated with logMAR BCVA. The blood density in the superficial and deep layers of the macular area of the affected eye was significantly lower than that of the contralateral eye. Compared with control eyes (P < 0.001, P < 0.001), the blood flow density in the superficial and deep layers was negatively correlated with logMAR BCVA; the CMT in the affected eyes was thicker than those in the contralateral and normal eyes (P < 0.001, P < 0.001). In Conclusion: OCTA has the advantages of non-invasive, convenient and accurate detec-tion of related indexes such as the superficial and deep retinal blood flow density and FAZ area in the macular area of RVO. The eyes of RVO patients had changes in the superficial and deep retinal blood flow density and superficial FAZ area compared with the contralateral and normal control eyes, and the FAZ area and blood flow density were related to the best corrected visual acuity of RVO eyes.
1. 引言
视网膜静脉阻塞(retinal vein occlusion, RVO)是第二大常见的视网膜血管性疾病。根据阻塞血管的位置,RVO可以分为视网膜分支静脉阻塞(branch retinal vein occlusion, BRVO)和视网膜中央静脉阻塞(central retinal vein occlusion, CRVO)。黄斑水肿、黄斑缺血、玻璃体积血以及新生血管形成等并发症的发生是RVO中视力下降的重要原因 [1],其中,黄斑水肿是影响视力最常见的并发症 [2]。但在临床中我们经常发现一些无黄斑水肿或经治疗后黄斑水肿好转的病人视力恢复并不理想,因此需要更多的诊疗技术进一步了解影响RVO视力预后的原因。
光学相干断层扫描血管成像技术(optical coherence tomography angiography, OCTA)是一种通过血液运动对比技术实现对视网膜及脉络膜血管结构的空间可视化的技术,其成像采集系统中最常见的一种算法是基于分频增幅去相关算法(split-spectrum amplitude-decorrelation angiography, SSADA) [3],现已被广泛应用于视网膜及脉络膜疾病的诊疗中 [4]。OCTA的优势有:首先其为无创性检查技术、无需静脉注入染料;其次能够分析和量化视网膜和脉络膜血管的密度,并自动生成外层视网膜、浅层视网膜、深层视网膜、脉络膜等不同血管层的图像;再者其能够描绘中心凹无血管区(foveal avascular zone, FAZ),并自动准确计算FAZ面积。本研究利用OCTA的检查优势,定量观察并分析RVO黄斑区血流密度、FAZ面积变化,进一步分析其与视功能的关系。
2. 对象和方法
2.1. 对象
选取2019年2月至2019年11月在蚌埠医学院第一附属医院就诊并确诊为RVO的患者56例(眼),排除因屈光间质较浑浊及无法固视的患者2人,最终纳入54例(眼),其中男28例,女26例,平均年龄55.26 ± 11.01;其中BRVO 34例(眼),男16例,女18例,平均年龄54.26 ± 9.89;CRVO 20例(眼),男12例,女8例,平均年龄56.95 ± 12.95。同时选取19例(眼)正常患者为对照组,男10例,女9例,平均年龄53.79 ± 10.77,与RVO患者在年龄及性别均不存在显著性差异。
排除标准:病理性近视,青光眼,眼外伤、葡萄膜炎病史,合并其他的视网膜疾病,严重的白内障,眼球震颤,已行抗VEGF及眼底激光治疗,质量差的OCTA图像(信号强度指数低于50)的患者均在排除之列。
2.2. 分组
选取RVO患者的患眼为A组,RVO患者的对侧眼为B组,健康对照眼为C组,本研究已通过医院伦理委员会审批,患者知情同意并已签订知情同意书。
2.3. 方法
所有患者均接受全面的眼科检查,包括使用对数视力表测量最佳矫正视力(Best corrected visual acuity, BCVA),OCTA,裂隙灯眼底检测。
OCTA采用Avanti RTVue XR (OptovueInc,Fremont,CA,美国)中的Angio Retina模式扫描完成,黄斑区扫描范围选用3 mm × 3 mm规格,扫描时嘱患者注视机器内蓝色视标不眨眼,保持至少3 s,获取两个正交的OCTA体积扫描并执行运动校正,去除最小化运动伪影;以黄斑中央凹为中心,聚焦于2个神经视网膜层:浅层毛细血管丛(superficial capillary plexus, SCP, SCP)和深层毛细血管丛(deep capillary plexus, DCP),使用带有OptovueRTVue XR AVANTI软件的AngioVue模块进行黄斑旁血流密度、平均视网膜血流密度以及黄斑中心凹厚度(central macular thickness, CMT)的测量。点击FAZ后,将在OCTA软件上使用内置软件自动选择和计算FAZ面积。所有患者的OCTA检查均由同一名熟练眼科技师完成。
3. 统计学方法
采用统计学软件SPSS23.0进行统计学分析,在进行统计学分析前将BCVA转换为最小分辨率(logMAR)当量的对数。所有值均以平均值±标准差表示。每两组之间使用独立样本t检验,相关性分析采用Pearson相关分析,P值<0.05被认为具有统计学意义。
4. 结果
1) RVO患者与正常对照组之间,RVO组平均年龄55.26 ± 11.01,正常对照组平均年龄53.79 ± 10.77,P = 0.546 (P > 0.05)差异不具有统计学意义。
2) 三组患者分别每两组之间比较两组患者FAZ测量值。A组、B组和C组FAZ平均值分别为0.46 ± 0.26 mm2、0.34 ± 0.11 mm2、0.33 ± 0.14 mm2;A组和B组相比P = 0.001,差异具有统计学意义;A组和C组比较,P = 0.012,差异具有统计学意义;B组和C组比较,P = 0.847 (P > 0.05),差异无统计学意义。见下表1。
3) 三组患者分别每两组之间比较两组患者深层及浅层黄斑旁血流密度、视网膜平均血流密度百分比测量值。A组和B组,A组和C组比较,差异均有统计学意义(P < 0.01)。B组和C组比较,差异无统计学意义。见下表1。
4) 三组患者分别每两组之间比较两组患者黄斑中心凹厚度(central macular thickness, CMT)。A组和B组,A组和C组比较,差异均有统计学意义(P < 0.01)。B组和C组比较,差异无统计学意义。见下表1。
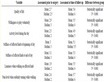
Table 1. Comparison of measurements between the three groups of patients
表1. 三组患者在各测量值间比较
注:A组:RVO患眼组;B组:RVO对侧眼组;C组:正常对照眼组;P1:A组与B组对比;P2:A组与C组对比;P3:B组与C组对比;P < 0.05有意义。
5) LogMAR BCVA分别与CMT、FAZ面积呈正相关,相关性分别为(r = 0.504、0.627,均P < 0.001),如图1,图2。
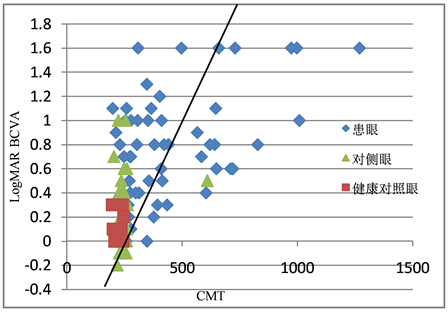
Figure 1. Relationship between CMT and LogBCVA in affected, contralateral, and healthy control eyes
图1. 患眼、对侧眼、健康对照眼CMT与LogBCVA的关系
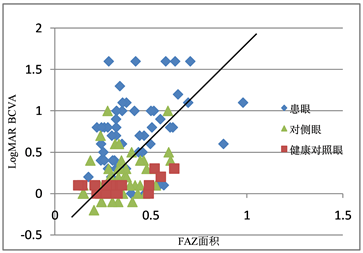
Figure 2. Relationship between FAZ and LogBCVA in affected, contralateral, and healthy control eyes
图2. 患眼、对侧眼、正常对照眼FAZ面积与LogBCVA的关系
6) LogMAR BCVA分别与浅层视网膜平均血流密度、深层视网膜平均血流密度呈负相关,相关性分别为(r = −0.505、−0.640,均P < 0.001),分别如图3~6。
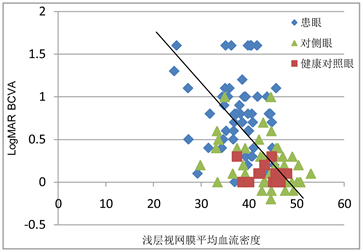
Figure 3. Relationship between superficial retinal blood flow density and LogMAR BCVA in affected, contralateral, healthy control eyes
图3. 患眼、对侧眼、正常对照眼浅层视网膜血流密度与LogMAR BCVA的关系
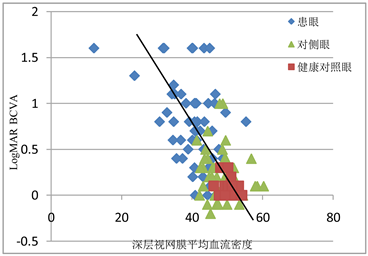
Figure 4. Relationship between deep retinal blood flow density in the affected eye, contralateral eye, and healthy control eyes and LogMAR BCVA
图4. 患眼、对侧眼、健康对照眼深层视网膜血流密度与LogMAR BCVA的关系
7) LogMAR BCVA分别与浅层视网膜黄斑旁血流密度、深层视网膜黄斑旁血流密度呈负相关,相关性分别为(r = −0.537、−0.608,均P < 0.001),分别如图5、图6。
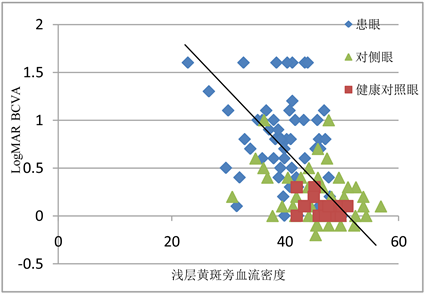
Figure 5. Relationship between superficial parafovea blood density and LogMAR BCVA in affected, contralateral, and healthy control eyes
图5. 患眼、对侧眼、健康对照眼浅层黄斑旁血流密度与LogMAR BCVA的关系
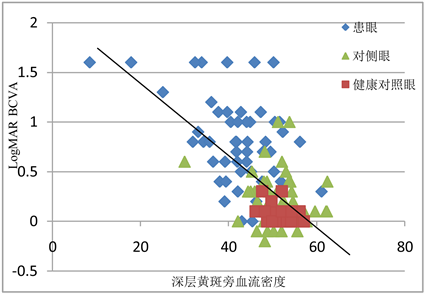
Figure 6. Relationship between deep parafovea blood density and LogMAR BCVA in affected, contralateral, and healthy control eyes
图6. 患眼、对侧眼、健康对照眼深层黄斑旁血流密度与LogMAR BCVA的关系
5. 讨论
RVO主要的眼底表现为受累的视网膜静脉迂曲扩张、火焰状出血、水肿渗出等。目前对于RVO具体的发病原因和机制仍不十分清楚,但一般认为RVO的原因与静脉血流瘀滞、血管外的压迫、静脉血管壁的损害有关。高血压病、糖尿病、动脉粥样硬化、年龄是RVO的全身危险因素;高眼压、眼轴长度、青光眼、屈光状态和视网膜微血管病变等是RVO的局部危险因素。随着RVO的发病率增加,近年来对于RVO的诊断和治疗技术也在不断探索中进步。
一直以来,眼底荧光血管造影(fundus fluorescein angiography, FFA)都是RVO诊断的金标准;由于荧光素染料不能通过完整的血–视网膜屏障,因此它是视网膜病变成像的极好的介质;FFA将视网膜血管循环可视化,帮助我们进一步了解导致视力丧失的致病机制 [5] [6]。但FFA是一项侵入性的有创检查,偶有过敏、恶心等副作用发生 [7] [8],不能作为长期随访观察病情变化的检查技术;且FFA由于染料的渗漏和汇集,使得视网膜的血管细节被掩盖;只能观察到浅层视网膜而对深层视网膜没法辨别。因此,寻求一种新的非侵入性的可以观察视网膜血管变化的检查技术很有必要。
自1990年由Huang等 [9] 发明光学相干断层扫描(optical coherence tomography, OCT)以来,在过去的几十年中不断地应用于眼科疾病的诊断中;OCTA是在OCT的扫描基础上一种速度更快的检查仪器,主要原理是将视网膜毛细血管内运动的红细胞作为内在造影剂,以流动的红细胞产生图像,而与运动方向无关 [10];OCTA通过在同一位置进行连续重复的多次B扫描,并自动比较所有扫描的结果,对于具有恒定对比度的静态信息自动删除,保留具有差异的信息即代表血管内的血液的流动。此前已有研究证明OCTA对于视网膜静脉阻塞中无灌注区,FAZ、浅层及深层视网膜血管丛密度等的检测就有较高的准确性及可重复性 [11]。Ho等研究表明,OCTA中扫描范围的模式选择对于FAZ面积的测量有一定的影响,3 × 3 mm扫描比6 × 6 mm扫描更清晰地描绘FAZ尺寸。这是因为与6 × 6 mm和8 × 8 mm相比,3 × 3 mm扫描的扫描密度更高,因此分辨率更高 [12]。因此我们选择了3 × 3 mm扫描模式。
FAZ是由视网膜中心凹无血管区内连续的毛细血管网络包围,但没有毛细血管结构的区域;黄斑中心凹几乎包含了所有的视锥细胞,一直是眼科工作中观察的重要指标 [13];作为无血管区域,FAZ可通过光学相干断层扫描(OCTA)进行可视化。虽然由于本研究所使用OCTA版本的限制无法测量DCP中FAZ的面积,但Coscas等人通过OCTA与FFA的比较,认为FFA中的FAZ主要代表SCP中的FAZ [14],所以本研究中的SCP中FAZ对于观察RVO患者FAZ面积变化及其与视功能的相关性仍是有意义的。本研究中发现RVO患者患眼的FAZ面积较健侧眼及健康对照眼明显增大,且均具有统计学意义(P < 0.05),这与之前的一项研究中报告了无论在SCP还是在DCP中RVO患者的患眼均较对侧眼扩大的结果是相同的 [15];本研究中对侧眼与健康对照眼相比,虽然FAZ面积有所增大,但不具有统计学意义;研究还发现FAZ面积与logMAR呈正相关,这与之前的研究结果是一致的 [16];这为以后预估RVO患者视力的预后有指导性的作用。同时本研究还发现在RVO患者中,SCP及DCP中的血流密度均较对侧眼和健康对照眼降低,同时发现SCP和DCP中的血流密度与logMAR呈负相关,这于Kang JW [17] 等人研究结果是一致的。本研究还发现血流密度在DCP中显著降低,可能与视网膜复杂的血管网有关,该网络由不同轴向水平排列的浅层、深层及脉络膜毛细血管丛组成 [18] [19];此外,深部毛细血管丛(DCP)的血管结构与主要静脉直接连通而缺乏血管平滑肌,使得DCP与SCP相比更容易受到RVO之后的血流动力学紊乱的影响以及随后的低灌注的发生 [20] [21]。DCP中的血管在视网膜血流中占有重要作用,DCP的低灌注可能会降低视觉功能。
虽然之前已有研究对于OCTA与FFA在RVO中的微血管结构进行比较,但大多为定性的研究,本研究定量研究并分析比较视网膜静脉阻塞中的微血管结构与视功能的相关性。对于单侧RVO的患者,不仅RVO患眼中的DCP及SCP中血流密度较对侧眼降低,FAZ面积大小较对侧眼增大;还发现对侧健康眼的各层血管丛中的血流密度低于正常对照眼,FZA面积大于正常对照眼,尽管这种差异不具有统计学意义。不仅在黄斑区,2018年Yong-Il Shin等 [22] 应用OCTA获得以视盘为中心的6 × 6 mm扫描,结果RVO患者对侧眼的平均视网膜神经纤维层、神经节细胞内丛状层厚度,视乳头周围毛细血管密度与健康对照眼相比均有差异;尽管在眼底检查中对侧眼可能看起来正常,但它受微血管灌注的影响。这表明,RVO的发展可能不是一个纯粹局部的眼部事件,至少在一些患者中,全身性改变可能影响双眼的视网膜血管系统,导致一只眼睛表现出RVO的体征。
本项研究也有一些局限性;首先,RVO患者样本量小;其次健康眼睛的对照组数量很少,并且没有以基于人群的方式收集。总之鉴于其无创和详细的深度分辨血管成像定量测量,OCTA可能成为诊断RVO黄斑缺血和视觉预后的重要有效工具,但未来需要更多大样本、长时间的随机实验来探查OCTA在RVO中的应用价值。
NOTES
*通讯作者。