1. 水资源分区和水资源量
1.1. 水资源分区
长江流域面积约180万km2,划分为金沙江石鼓以上、金沙江石鼓以下、岷沱江、嘉陵江、乌江、宜宾至宜昌、洞庭湖水系、汉江、鄱阳湖水系、宜昌至湖口、湖口以下干流、太湖水系12个水资源二级区(见表1)。前6个水资源二级区为长江上游,中间4个为长江中游、后2个为长江下游。
1.2. 水资源量
长江流域水资源公报2002年及以前是按第一次水资源评价分区统计,2003年以后是按第二次水资源评价分区统计,因此本文主要分析2003~2015年13年水资源量资料 [1] ,而多年平均水资源量 [2] 仅供全流域平均值前后对比。
1.2.1. 多年平均水资源量
长江流域1956~2000年平均年降水深为1086.6 mm,地表水资源量为9856亿m3,地下水资源量的不重复量为102.3 × 10⁸m3,水资源总量为9958 × 108m3,流域平均产水系数为0.51,产水模数为55.86万m3/km2。根据水资源公报资料,将资料系列延长到2015年共60年资料系列,1956~2000年45年系列平均水资源总量比延长后的60年系列平均水资源总量偏小1.1%,说明1956~2000年系列仍具有代表性。
1.2.2. 近13年水资源量
长江流域2003~2015年平均年降量为1055.9 mm,比常年值(1956~2000年平均值,下同)偏少2.8%,13年中包括了丰水年份、平水年份、枯水年份 [3] 。2010年、2012年降水量比常年偏多6.8%、6.7%,是偏丰水年份;2005年、2008年、2014年是正常年份;2011年降水量比常年偏少14.3%,是偏枯水年份。这13年平均水资源总量比常年值偏少5.0%,最大与最小年值之比为1.44。因受降水地区分布各年不同的影响,各水资源二级区丰、平、枯的年份与流域不完全一致(见表1)。2010年流域降水偏丰,中下游地区的二级区偏丰,但宜宾至宜昌、
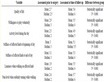
Table 1. Comparison of precipitation and annualized values of water resources zoning from 2003 to 2015
表1. 2003~2015年水资源二级区降水量较常年变化统计(%)
注:表中计算当年降水来自 [1] ,多年平均值来自 [2] 。
金沙江石鼓站以下偏枯;2011年流域降水偏枯,但汉江、嘉陵江偏丰。
2. 总用水量
用水量指分配给用水户的包括输水损失在内的毛用水量,按农业、工业、生活(含生态环境)用水统计。农业用水包括农田灌溉和林业、果树、草地灌溉、鱼塘补水及牲畜用水。工业用水为取用的新水量,不包括企业内部的重复利用量。生活用水包括城镇生活用水和农村生活用水,其中城镇生活用水由居民生活用水、公共用水(含第三产业和建筑业等用水)和城镇环境用水组成,农村生活用水由居民生活用水和农村生态补水组成 [4] [5] 。
2.1. 总用水量变化情况
全流域(含上、中、下游)及水资源二级区用水量年均递增率见表2。其中,2003~2015年长江流域平均总用水量为1937.7 × 108 m3,其中2003年为1702.6 × 108 m3,2015年达到2054.6 × 108 m3,相比增加352.0 × 10⁸ m3,年均递增率为1.58%。上游6个水资源二级区用水增加69.5 × 10⁸ m3,年均递增率为1.4%,其中嘉陵江、金沙江石鼓以上和宜宾至宜昌干流增长较快,年均递增率分别为2.41%、1.85%和1.83%;中游4个水资源二级区用水增加143.1 × 10⁸ m3,年均递增率为1.39%,其中鄱阳湖水系增长较快,年均递增率为3.25%;下游2个水资源二级区用水增加139.5 × 10⁸ m3,年均递增率为1.97%,湖口以下干流增长较快,年均递增率为3.26%。可见长江下游地区用水增长速度快于长江上中游。
2.2. 用水组成
2003~2015年长江流域农业用水量占总用水量的51%左右,工业用水量占总用水量的36%左右,生活用水量占总用水量的13%左右。2003年到2015年,随着工业和城市的发展,流域用水组成有了一定的变化。农业用水占总用水量的比例,由2003年的55.0%下降到2015年的48.6%;同期工业用水比例由33.2%上升到35.8%,生活用水比例由11.8%上升到15.7%。2003~2015年长江流域各项用水量组成变化见图1。
Table 2. Annual growth rate of water use in water resources from 2003 to 2015
表2. 2003~2015年水资源二级区用水量年均增长率(%)

Figure 1. 2003-2015 Yangtze River Basin water composition changes
图1. 2003~2015年长江流域用水量组成变化
流域内各地由于水土资源组合条件及经济发展水平的差异,其用水组成也有所不同。2003~2015年长江上、中、下游地区农业用水量占总用水量的比例分别在53%、61%、36%左右,工业用水量占总用水量的比例分别在30%、28%、51%左右,生活用水量占总用水量的比例分别在17%、12.0%、13%左右。长江中游地区是流域主要农业生产基地,农业用水所占比例大,长江下游地区是流域内工业和城市比较发达地区,工业用水所占比例大。水资源二级区中除宜宾至宜昌、太湖水系是工业用水占总用水量比例最大外,其余二级区均是农业用水所占比例最大;除金沙江石鼓以上是工业用水占总用水量比例最小外,其余二级区均是生活用水所占比例最小。
2015年与2003年比较,长江上、中、下游地区农业用水占总用水量的比例分别下降了2.9、5.2、9.8个百分点;工业用水量占总用水量的比例上游下降4.2个百分点,中、下游上升了1.5、7.7个百分点,生活用水量占总用水量的比例上升了7.1、3.7、2.1个百分点。水资源二级区中,农业用水占总用水量的比例下降了1.0~12.0个百分点,其太湖水系下降比例最大,金沙江石鼓站以上次之,嘉陵江下降比例最小;工业用水占总用水量的比例有升有降,太湖水系、湖口以下干流、洞庭湖水系、金沙江石鼓以下、鄱阳湖水系、金沙江石鼓站以上升0.6~9.6个百分点,其中太湖水系上升比例最大,余下6个二级区下降,下降1.9~6.6个百分点,其中宜宾至宜昌下降比例最多;生活用水占总用水量的比例均上升,上升最多的是岷沱江。
2.3. 用水指标
2.3.1. 人均用水量
2003~2015年期间,流域总用水量与总人口基本同步增长,人均综合用水量变化不大,2003年为394 m3,2015年为452 m3。2015年流域内各二级区的人均用水量情况是:湖口以下干流最高,为703 m3;太湖水系、鄱阳湖水系、宜昌至湖口、洞庭湖水系较高,分别为569 m3、542 m3、513 m3、481 m3;汉江、岷沱江、金沙江石鼓以下、金沙江石鼓以上、宜宾至宜昌分别为413 m3、348 m3、314 m3、292 m3、262 m3;乌江、嘉陵江较低为250 m3和240 m3。
2.3.2. 万元GDP 用水量
按2000年不变价计算(下同),2003~2015年流域GDP的年均递增率为9.0%,总用水量的年均递增率为1.58%,后者的增长速度低于前者。平均万元GDP用水量从2003年的431 m3下降到2015年的184 m3,表明综合用水效率有较大提高,单方水GDP产值由23.2元提高到54.3元。2015年各水资源二级区万元GDP用水量情况是:鄱阳湖水系最高,达337 m3;金沙江石鼓以上、洞庭湖水系较高,为272 m3和248 m3;湖口以下干流、汉江、宜昌至湖口、金沙江石鼓以下、嘉陵江、岷沱江、乌江、宜宾至宜昌在215 m3~145 m3;太湖水系最低为112 m3。
3. 农业用水
3.1. 农田灌溉用水
2003年至2015年,长江流域农田实灌面积总体呈增加趋势,农田实灌面积年均递增率为0.38%,灌溉用水量年均递增率为0.40%。长江流域平均每亩用水量略有增加。
由于长江流域范围广,上下游的水土资源条件不同,其农田实灌面积和用水变化情况有所差别。长江上游水资源相对贫乏,但土地资源较为丰富,耕地灌溉率较低;2003~2015年,实灌面积增加284.6万亩,每亩用水量增加4.0 m3,灌溉用水量增加13.24 × 10⁸ m3。长江中游水资源丰富,土地资源也较为丰富,在采用节水灌溉和非充分灌溉措施后,灌溉面积明显增加;2003~2015年,实灌面积增加593.85万亩,每亩用水量增加11.2 m3,灌溉用水量增加39.6 × 10⁸ m3。长江下游水资源丰富,但土地资源有限,耕地灌溉率高,发展灌溉面积的潜力不大;2003~2015年,实灌面积增加20.12万亩,每亩用水量减少26.6 m3,灌溉用水量减少11.27 × 10⁸ m3。
农田灌溉是长江流域用水大户,但用水弹性大,节水潜力也大。只要加大投入,采取节水、高产综合措施,在不增加或少增加供水量的情况下,仍可维持灌溉面积和粮食总产稳步增长,已为十几年的实践所证明。从2003年至2015年,流域农田灌溉用水稳定在890 × 108 m3左右,而粮食总产量由13,941万t增至17,408.4万t,相应人均粮食占有量从323 kg提高到383 kg。
3.2. 林牧渔畜用水
林牧渔畜用水包括林果地(果树、苗圃、经济林、防护林)、草场(人工草场、饲料基地和天然草场)灌溉用水、人工鱼塘补水及牲畜用水等。
随着农村多种经营的快速发展,流域林牧渔畜用水逐年增长,2003年82.0 × 10⁸m3,2015年增加到101.24 × 10⁸ m3。各水资源二级区的林牧渔畜用水增减不一,2015年与2003年比较,鄱阳湖水系、乌江、金沙江石鼓以上林牧渔畜用水量减少,其余二级区均增加,岷沱江、嘉陵江、宜昌至湖口增加较多(见图2)。
4. 工业用水
工业包括火(核)电工业、国有及规模以上非国有工业和规模以下非国有工业。流域内工业发展迅速,按2000年不变价格计算,2003~2015年长江流域工业产值年均递增率为9.8%。同期工业用水(取用新鲜水量)也明显增加,2003年为565.4 × 10⁸ m3,2015年为734.6 × 10⁸ m3,年均递增率为2.2%,其增长速度低于工业产值增长速度,弹性系数为0.23。随着工业结构调整、工艺技术进步及节水水平提高,万元工业产值用水量迅速下降,由2003年的336 m3下降到2015年的142 m3。工业产值、工业用水量及万元工业产值用水量的变化趋势见图3。
从流域上中下游分布看,上游2015年的工业用水为112.4 × 10⁸m3、万元工业产值用水量为88 m3,2003~2015年的用水年均递增率为0.08%、弹性系数为0.01;中游2015年的工业用水为256.1 × 10⁸ m3、万元工业产值用水量为139 m3,2003~2015年的用水年均递增率为1.90%、弹性系数为0.15;下游2015年的工业用水为366.0 × 10⁸ m3、万元工业产值用水量为180 m3,2003~2015年的用水年均递增率为3.3%、弹性系数为0.47。工业用水总量、用水增长速度、单位产值用水量均是下游最大,中游其次,上游最小。
水资源二级区中,2015年工业用水量以太湖水系最大,湖口以下干流次之,金沙江石鼓以上最小;万元工业产值用水量湖口以下干流最大,鄱阳湖水系次之,岷沱江最小。用水年均增长速度除岷沱江、乌江为负增长外,其余二级区均为正增长,以湖口以下干流增长速度最大。
5. 生活用水
2003~2015年流域生活用水逐年增加,年均递增率为4.1%。

Figure 2. Forest, animal husbandry, fishing, livestock water consumption difference during 2015 and 2003
图2. 2015年与2003年林牧渔畜用水量差值

Figure 3. Trend of industrial output value and water consumption in Yangtze River Basin
图3. 长江流域工业产值和用水量变化趋势
5.1. 城镇生活用水
随着城市化率的提高,城镇人口逐步增加,加之人民生活水平不断改善,生活用水量增长很快。流域城镇生活用水量由2003年的125.9 × 10⁸ m3持续增加到2015年的259.7 × 10⁸ m3,年均递增率为6.2%,与同期城镇人口年均递增率5.7%基本持平。各水资源二级区城镇生活用水量均持续增加,金沙江石鼓以上、岷沱江、汉江、乌江年均递增率较大,太湖水系、金沙江石鼓以下年均递增率相对较小。
由于流域上下游的气候条件和人们生活习惯不同,人均生活用水量有较大的差别。2015年长江上游人均用水量256 L/d,其中金沙江石鼓以下最低;长江中游人均用水量291 L/d,其中宜昌至湖口较高,鄱阳湖水系较低;长江下游人均用水量292 L/d。
5.2. 农村生活用水
在我国控制总人口增长率的条件下,随着城市化率的提高,农村人口不断向城镇转移,农村人口基本是逐年减少,加之农村生活用水定额低,用水量有逐年下降趋势。长江流域农村生活用水量2003年为74.3 × 10⁸ m3,2015年为62.6 × 10⁸ m3,年均递减率1.4%,小于同期农村人口年均递减率3.3%。2015年与2003年比,水资源二级区中农村生活用水量有增加,有减少,金沙江石鼓以上、金沙江石鼓以下、岷沱江、汉江增加,其余二级区减少,金沙江石鼓以上年均递增率较大,洞庭湖水系年均递减率较小。
长江流域农村人均生活用水量2015年平均为85.3 L/d,长江上游最小为80.7 L/d,长江中游为84.7 L/d,长江下游最大为99.8 L/d。
6. 结语
(1) 从2003年至2015年,长江流域用水量的变化趋势是:总用水量由1702.6 × 108 m3增加到2054.6 × 108 m3,年均递增率为1.58%;用水组成有明显变化,工业用水比例增加2.5个百分点,生活用水比例增加3.9个百分点,农业用水比例减少了6.5个百分点;人均用水量变化不大,稳定在430 m3左右;综合用水效率大为提高,万元GDP (2000年可比价)用水量由431 m3下降到184 m3。
(2) 农业是长江流域的用水大户,2003年农业用水为936.9 × 10⁸ m3,占总用水量的55.0%,2015年农业用水达到997.7 × 10⁸ m3,占总用水量的48.6%。12年间农田灌溉用水变化不大,而灌溉面积和粮食产量均有增加,单位面积用水量明显下降。表明农田灌溉的用水弹性和节水潜力较大。
(3) 工业是第二用水大户,其用水量增长较快,节水潜力也大。2003年与2015年相比,工业用水量由565.4 × 10⁸ m3增加到734.6 × 10⁸ m3,万元工业产值用水量则由336 m3下降至142 m3。从保护生态环境和防治水污染的角度考虑,今后应进一步调整工业结构和企业规模,提高工业用水重复利用率,使万元工业产值用水量继续下降。
(4) 长江流域生活用水量2015年为322.3 × 10⁸ m3,占总用水量的15.7%。生活用水量中城镇生活用水量占70%,农村生活用水量占30%。