1. 引言
选煤厂设计工作中原煤粒度组成影响分级、煤泥水处理、沉淀等作业的产率,也影响到这些作业的设备选型及处理效果。粒度特性方程是研究表述散状物料粒度特性的主要方法,它是根据筛分试验数据,用数学方法加以归纳、整理,建立起能正确反映颗粒大小分布规律的数学模型,以便于统计分析和计算机的复杂运算[1] 。罗辛—拉姆勒方程式(简称R-R方程式)是较为常用的表示松散物料粒度特性方程式之一,适用于煤的自然破碎或人工破碎的产品,不但适用于细粒煤,也适用于原煤。世界上有些国家在选煤厂设计中也采用这个方程式,而且R-R方程式在水煤浆制备领域也得到了有效应用[2] 。
目前通行的R-R-B线图画法是把R-R方程式进行变换,得到直线化的R-R-B线图。本文使用MATLAB软件,编制程序,直接绘制R-R-B曲线图,并通过实验比较,得出使用MATLAB软件方法的一些优点。
2. R-R-B线图的通行画法[3]
目前通行的R-R-B线图的画法是先把R-R方程式变换为直线方程,其过程如下。
R-R方程为
 (1)
(1)
式中:R大于筛孔d的累计产率,%;
d筛孔尺寸,mm;
b与物料粒度大小有关的参数;
n与物料性质有关的参数。
由方程(1)变换可得
两边去对数得:
再次取对数得:
取 ,
, ,
, ,则上式可变换为:

以y为纵坐标,x为横坐标,画出坐标图,那么由筛分资料的一组数据在此图上即成为一条直线。
以某选煤厂浓缩机入料为例,筛分试验结果见表1,筛分试验是严格按照行业标准GB/T 19093-2003《煤粉筛分试验方法》所规定的预先湿法脱泥—干法筛分步骤进行的。方程式(2)为拟合后的直线方程,图1是方程(2)的图形,即为直线形式的R-R-B粒度分布图。纵坐标表示筛上物累计产率,横坐标表示粒度,R-R方程的拟合和R-R-B线图的绘制具体方法可参考顾民兆的《选煤厂工艺流程与设备选型计算》一书[4] 。
拟合后方程为
 (2)
(2)
3. 用MATLAB软件画R-R-B图
由上文可知现在通行的R-R-B图画法需要进行方程和横纵坐标的转换,过程繁琐,虽然画出来的R-R-B线图是直线,但是R-R-B线图横坐标和纵坐标是对数坐标,坐标刻度不均匀,在查找某一粒度的累计产率时,查找困难,结果很难精确。

Figure 1. R-R-B particle size distribution of linear form
图1. 直线形式的R-R-B粒度分布图
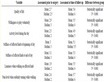
Table 1. Thickener feeding screening test table
表1. 浓缩机入料筛分试验表
MATLAB是矩阵实验室(Matrix Laboratory)的简称,是美国MathWorks公司出品的商业数学软件,是三大数学软件之一。我们可以用MATLAB软件直接把表1中的X、Y拟合成方程(1)的形式,写出拟合后的方程,并画出拟合曲线,过程简单,其具体编程如下[5] 。
xData =[0.25,0.125,0.075,0.045,0.030]';
yData =[6.05,15.82,31.60,50.01,60.19]';
% Set up fittype and options.
ft = fittype('100*exp(-b*x^n)', 'independent', 'x', 'dependent', 'y');
opts = fitoptions(ft);
opts.Display = 'Off';
opts.Lower = [-Inf -Inf];
opts.StartPoint = [0.913375856139019 0.63235924622541];
opts.Upper = [Inf Inf];
% Fit model to data.
[fitresult, gof] = fit(xData, yData, ft, opts)
% Plot fit with data. figure('Name', 'fit曲线');
x1 = 0:0.01:1;
h = plot(x1,fitresult(x1), xData, yData, '*');
legend(h, 'y vs. x', '拟合曲线', 'Location', 'NorthEast');
% Label axes
xlabel('粒度mm');
ylabel('累积产率%');
grid minor
把上述程序输入MATLAB软件,运行结果如下。
fitresult =
General model:
fitresult(x) = 100*exp(-b*x^n)
Coefficients (with 95% confidence bounds):
b = 11.08 (6.562, 15.61)
n = 0.8821 (0.7377, 1.026)
gof =
sse: 29.5191
rsquare: 0.9856
dfe: 3
adjrsquare: 0.9808
rmse: 3.1368
即粒度特性R-R方程为:

得到的拟合曲线,曲线形式的R-R-B线图,见图2。
结果中rsquare是曲线拟合的相关指数,表示拟合的好坏,rsquare的值越接近1,拟合效果越好。本例的rsquare等于0.9856,说明拟合效果很好,用MATLAB软件直接拟合R-R-B线图可行。
4. 两种拟合方法的对比
为了比较两种拟合方法拟合效果的好坏,我们以山东兖州矿业集团下属某矿两个工作面的原煤煤泥为例,来进行两种方法拟合效果的对比,原生煤泥小筛分资料见表2。因为两种方法都是按照最小二乘法拟合而成,评价最小二乘法拟合效果的主要参数是相关指数,所以我们可以通过相关指数来比较两种方法拟合效果;我们还可以比较两种拟合方程预测的某粒度的产率与实际筛分产率的差值来比较拟合的好坏。上面的原生煤泥在进行小筛分试验时,没有采用200网目的筛子,我们可以增加200网目的筛子再次进行筛分实验,可以得到原生煤泥大于200网目的实际产率,把实际产率与通过拟合方程(曲线)预测的产率进行对比,就可以看出拟合效果的好坏,拟合效果对比表见表3。

Figure 2. R-R-B line diagram of curve form
图2. 曲线形式的R-R-B线图
Table 2. Primary slime small screening table
表2. 原生煤泥小筛分表
Table 3. Fitting effect comparison table
表3. 拟合效果对比表
比较表中的数据可知:1301、4302两个工作面的原生煤泥拟合方程的相关指数R2都是MATLAB方法大于通行方法,产率差值也都是MATLAB方法的较小,说明MATLAB方法拟合效果较好。
5. MATLAB画法的优点
使用MATLAB软件来拟合R-R方程、绘制R-R-B曲线与目前通行的做法相比较,有以下几个优点。
第一,方程拟合和图形绘制过程简单。使用通行的方法来拟合方程时,必须先进行方程式和坐标的变换,然后用最小二乘法求出误差最小的回归方程;在绘制R-R-B线图时,还需要先绘制对数坐标系,过程十分麻烦。而用MATLAB软件来进行R-R方程的拟合和R-R-B曲线的绘制时,仅需要输入编制好的程序,拟合方程和曲线的绘制就可同时完成,方法十分快捷。
第二,拟合结果更准确。复杂的过程意味着多次的四舍五入,就造成了结果的相对不准确,表3中数据的对比可以说明使用MATLAB直接拟合结果更精确。
第三,再次使用方便。在煤质资料改变时,通行的方法重新绘制R-R-B线图时,需要重做所有工作,很繁琐。而使用MATLAB方法只需要把程序中的xData、yData中的数据分别换成改变后的粒度和累积产率即可,十分方便。
6. 结论
我国选煤厂各类煤泥的粒度特性都符合R-R方程式的分布规律,R-R-B图可做直观定量的描述,使用MATLAB软件来进行R-R方程式的直接拟合和R-R-B线图的绘制,省去了人工计算、拟合和绘图的过程,使过程更加简单,结果更加精确,在以后研究散状物料粒度特性时,推荐使用此种方法。